After peaking in May of 2012, this key industry has struggled since, but MoneyShow's Tom Aspray now sees bullish setups in some stocks and an ETF.
Alcoa, Inc. (AA) officially kicks off the earnings season after the close today but it is just one of the forces impacting the market. There was a mixed close on Wednesday with the Nasdaq Composite and Nasdaq 100 finishing higher. The banks and biotech also did well as the market waits for Friday's monthly jobs report.
The S&P 600 was one of the weakest sectors, losing over 2%, and the weekly close for this index could cause further deterioration in the technical studies. The market appears to be undergoing a sector rotation correction as the homebuilders were strong. The stock index futures are showing nice gains in early trading.
The sharp rally in the homebuilding stocks in reaction to the Fed's taper appeared to complete the correction in these stocks after they peaked last May. There were signs in December that these stocks could again lead the market in 2014. Many of the homebuilders show bullish setups on the daily charts, creating reasonable-risk trades in an industry group that appears to have bottomed. Here are my favorites.
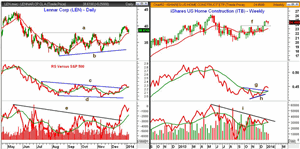
Chart Analysis: Lennar Corp. (LEN) has been a leader in the homebuilding sector as it is up 14.6% in the past three months compared to a 11.5% gain in the Spyder Trust (SPY).
- LEN had a high in May of $44.28 so it is still 12.8% below these highs.
- The daily chart shows that LEN has pulled back to initial support, line a, and the 20-day EMA.
- The breakout from the base formation (lines a and b) has targets in the $43.50 with the monthly projected pivot resistance at $43.67.
- The relative performance completed its bottom formation by moving through the resistance at line c.
- The RS line has now pulled back to the breakout level and its rising WMA.
- The on-balance volume (OBV) was very strong in December as it surged through resistance at line e, and came close to the May highs.
- The quarterly pivot is at $37.21 with stronger support in the $34.50-$35.50 area.
The weekly chart of the iShares US Home Construction ETF (ITB) shows the breakout above resistance, line f, that goes back to last September.
- The quarterly pivot is at $23.52 with the rising 20-week EMA at $23.00.
- The weekly relative performance has moved above the resistance at line d, completing the bottom formation.
- The RS line has turned down but is well above its rising WMA.
- The weekly OBV tested its WMA in December and is now testing it once more.
- A move above the downtrend at line i would be very positive.
- The daily studies (not shown) are positive and did confirm the upside breakout.
- The 61.8% Fibonacci resistance from the May high at $26.19 has been overcome.
- The monthly projected pivot resistance is now at $26.72.
NEXT PAGE: 2 of Tom's Favorite Homebuilders
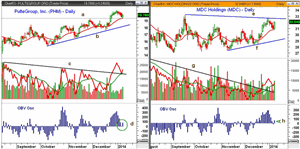
|pagebreak|PulteGroup, Inc. (PHM) is a $7.6 billion homebuilder that dropped down to test the 20-day WMA and the breakout level at $19.31 (line a) yesterday.
- There is further support at $18.71 and the quarterly pivot.
- The daily uptrend is significantly lower at $18.17.
- The daily OBV staged a strong upside breakout last month as the resistance at line c was overcome.
- The volume Wednesday was the highest of the past two weeks.
- Below the OBV is a new indicator, the OBV Osc, which I discuss in more detail in this week's trading lesson (see below to get a copy).
- The OBV Osc dropped below zero Tuesday but then reversed to the upside as the OBV has turned up after testing its rising WMA.
- There is resistance next at the recent high of $20.49 and then $21.62.
- The monthly projected pivot resistance is at $22.34 with the May high of $24.33.
MDC Holdings (MDC) is a $.157 billion residential home and financial services company that had a high last May of $40.93.
- At the end of December, the high was $32.68 with the July high at $34.71.
- The monthly projected pivot resistance for January is at $35.48 with the 61.8% Fibonacci retracement resistance at $35.59.
- The daily OBV moved through its downtrend, line g, in December and has just pulled back to test its rising WMA.
- The weekly OBV (not shown) is also above its WA so the multiple time frame OBV) is positive.
- The daily OBV Osc moved above the zero line on December 13 when MDC closed at $28.83.
- The Osc reversed back into positive territory on Wednesday.
- There is first support now at $30.85-$30.73 with stronger in the $29.50-$30 area.
What It Means: The bullish setups in the homebuilders and the homebuilding ETFs are generally quite reliable. The OBV Osc can help one better identify these setups and often will alert the trader or investor to longer-term tops and bottoms. It will be discussed in more detail in today's Trading Lesson (To receive a copy, sign up here).
If these stocks or the ETF move to new highs for 2014 before hitting my buy levels, I would cancel the orders. MDC Holdings (MDC) has the highest risk and should be considered only for more aggressive accounts.
I am also keeping an eye on the SPDR Homebuilder ETF (XHB), as well as some of the other homebuilding-related stocks.
How to Profit: For iShares US Home Construction ETF (ITB), go 50% long at $24.34 and 50% at $23.77, with a stop at $22.87 (risk of 4.9%).
For PulteGroup, Inc. (PHM), go 50% long at $19.71 and 50% at $18.83, with a stop at $18.29 (risk of 5.1%).
For MDC Holdings (MDC), go 50% long at $31.68 and 50% at $30.74, with a stop at $29.34 (risk of 6%).
These recommendations were Tweeted before the opening on January 9.
Portfolio Update: Should be 100% long Lennar Corp. ((LEN) at $33.17 with a wide stop for now at $34.19. On a move above $39.50, raise the stop to $36.22. Sell 1/3 at $42.44.


